
Existing Home Sales Drop Despite Record High Prices
Existing house sales decreased for the third consecutive month in May, owing to persistently high mortgage rates and record-high prices, according to the National Association of Realtors.
Low resale availability and high demand continued to drive up existing house prices, making this the eleventh consecutive month of year-over-year median sales price increases.
However, growing inventory is projected to reduce home price rise in the coming months.
Homeowners with lower mortgage rates have chosen to stay put, rather than trading in for higher rates. This pattern is driving up property prices while decreasing resale inventory.
Mortgage rates are predicted to gradually fall, resulting in greater demand (and unlocking lock-in inventory) in the coming quarters. However, this drop is contingent on future inflation reports.
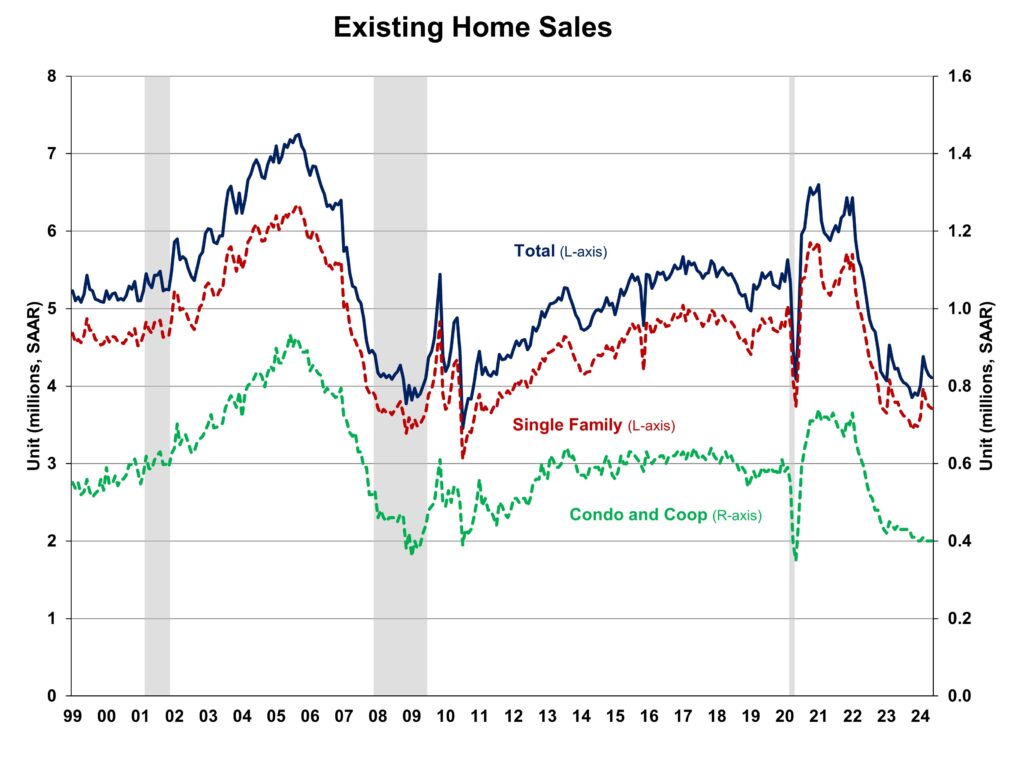
On a seasonally adjusted annual basis, total existing home sales in May fell 0.7% to 4.11 million, including single-family homes, townhomes, condominiums, and co-ops.
Sales dropped 2.8% year on year.
In May, the percentage of first-time purchasers fell to 31%, down from 33% in April but up from 28% in May 2023.
The inventory level rose from 1.20 million units in April to 1.28 million units in May, reflecting an 18.5% rise over the previous year.
The unsold inventory for May is currently at a 3.7-month supply, which is an increase from 3.5-months last month and 3.1-months a year ago, at the current sales rate.
This inventory level is significantly lower than that of a balanced market (4.5 to 6 months’ supply), which underscores the long-term necessity for additional home construction.
Nevertheless, the number of single-family resale residences available for sale has increased by nearly 18% on a year-over-year basis, with a 7.7% increase in May.
Homes were on the market for an average of 24 days in May, which is a decrease from the 26 days in April but an increase from the 18 days in May 2023.
In May, the all-cash sales proportion was 28% of transactions, which was consistent with April but increased from 25% a year ago. Changes in interest rates have a lesser impact on purchasers who pay in cash.
The median sales price of all existing properties in May was $419,300, which represents a 5.8% increase from the previous year.
This was the most expensive price ever recorded. In May, the median condominium/co-op price increased by 5.1% from the previous year, at $353,300. As inventory increases, the rate of price growth will diminish.
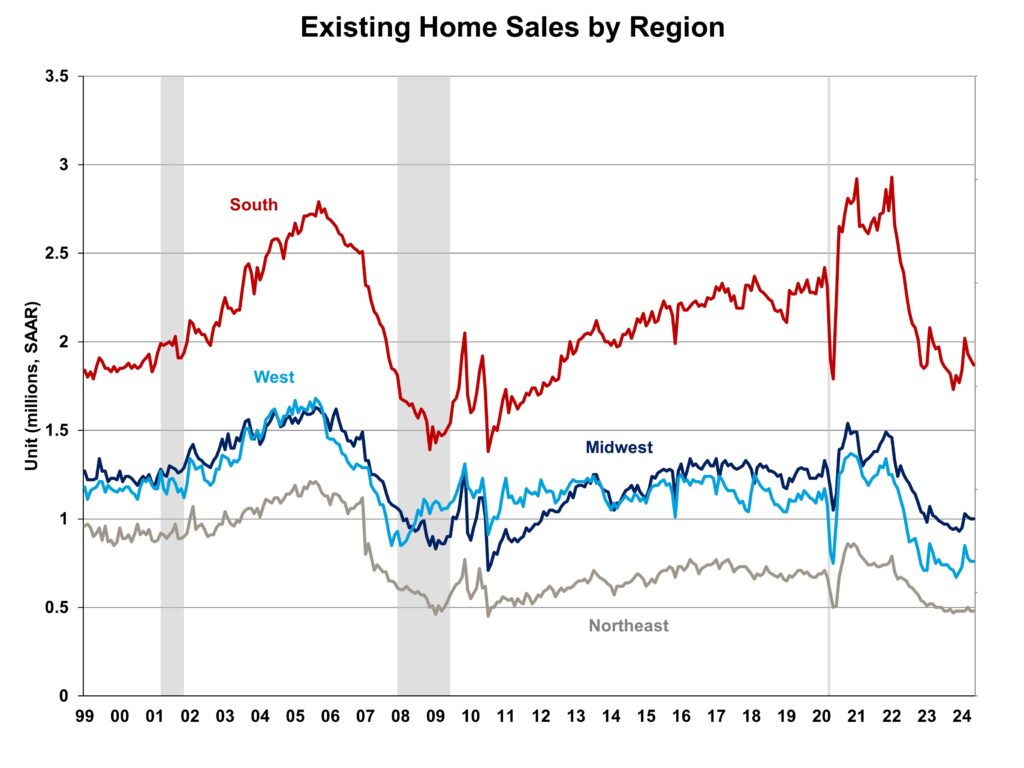
The four main regions experienced a mixed performance in terms of existing home sales in May, as illustrated below.
In May, sales in the Northeast, Midwest, and West remained unaltered, while sales in the South experienced a 1.6% decline.
Sales decreased in three of the four regions on a year-over-year basis, with the West experiencing a 1.3% decrease and the South experiencing a 5.1% decrease.
Sales in the Midwest increased by 1.0% from the previous year.
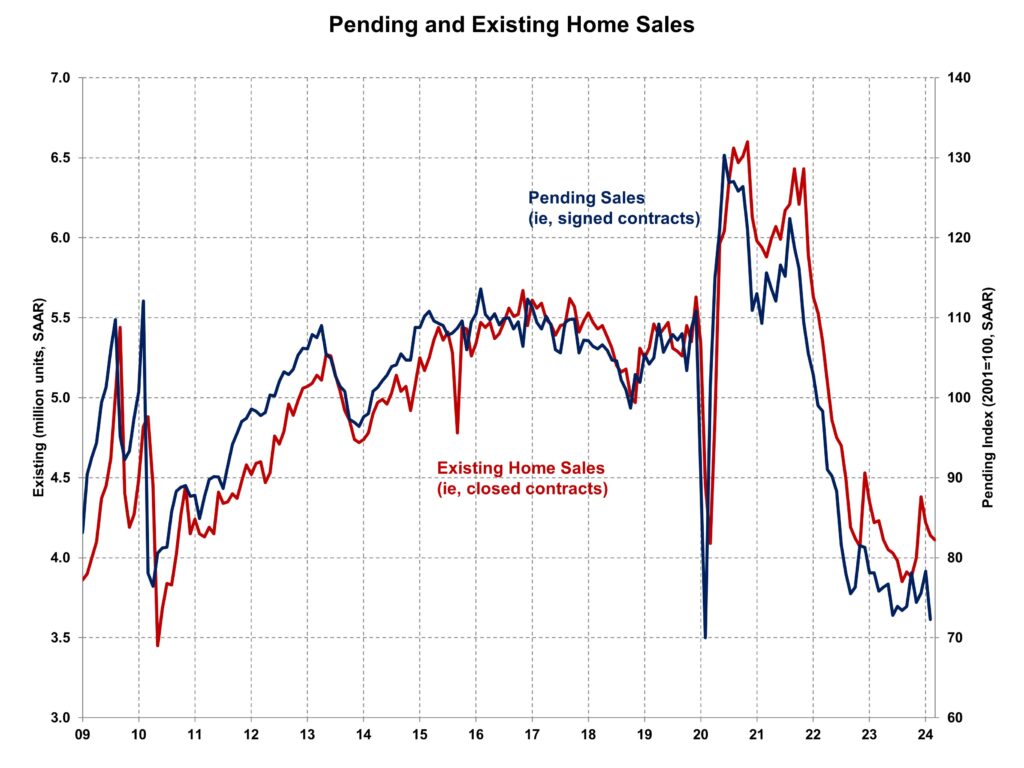
The Pending Home Sales Index (PHSI) is a forward-looking indicator that is calculated using signed contracts.
In April, the PHSI decreased from 78.3 to 72.3. The NAR data indicates that pending sales were 7.4% lower than they were a year ago on a year-over-year basis.
[Read more about this topic on Eyeonhousing.org]