NAHB: Building Material Price Growth Tracking Close to 2023
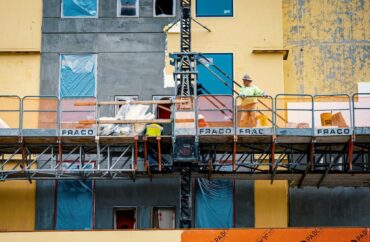
Residential construction inputs, excluding food and energy, fell 0.04% in July, according to the most recent Producer Price Index (PPI) report published by the U.S. Bureau of Labor Statistics (BLS).
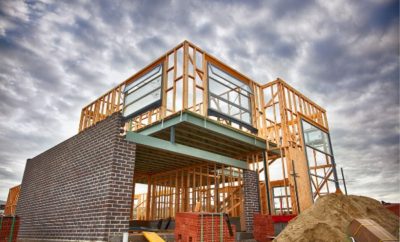
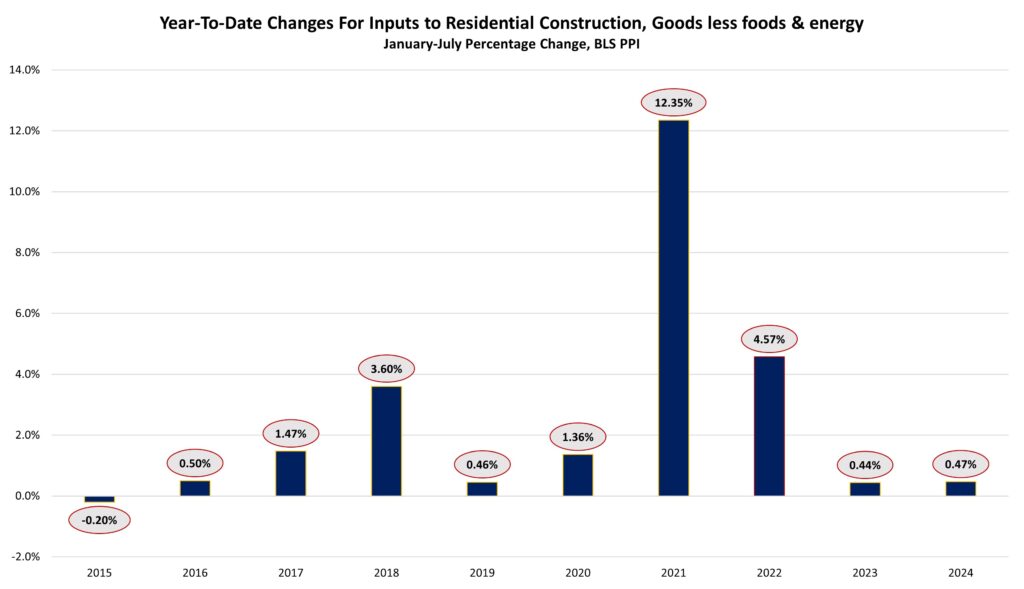
The index for residential construction inputs, excluding food and energy, represents building materials utilized in residential construction.
In July, the index increased by 2.01% over the previous year, marking the sixth month in a row with rise of more than 2%.
The index has increased by 0.47% year to date (YTD) as of just over the halfway of 2024.
This is slightly higher but yet similar to the YTD growth rate for 2023, which was 0.44%.
The seasonally adjusted PPI for final demand goods grew by 0.62% in July, following a revised 0.36% decrease in June. In July, the PPI for final demand energy jumped by 1.90%, final demand food rose by 0.61%, and final demand goods, excluding food and energy, rose by 0.24%.
The BLS producer pricing indices track the average change in selling prices for domestic producers’ output.
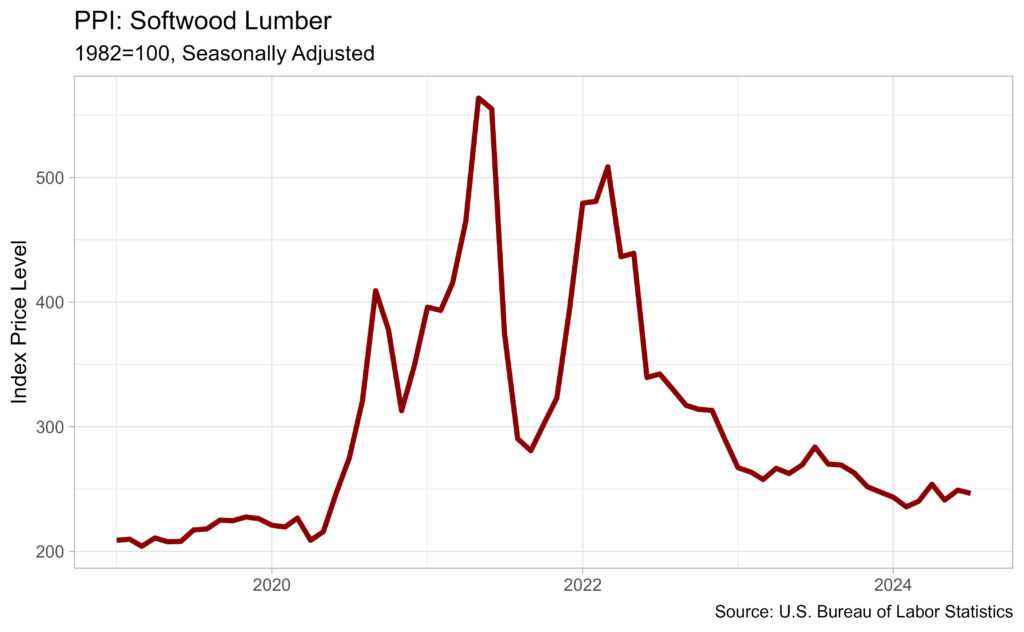
The seasonally adjusted PPI for softwood lumber declined 1.04% in July after increasing 3.29% in June. In July 2023, softwood lumber prices fell 13.12%.
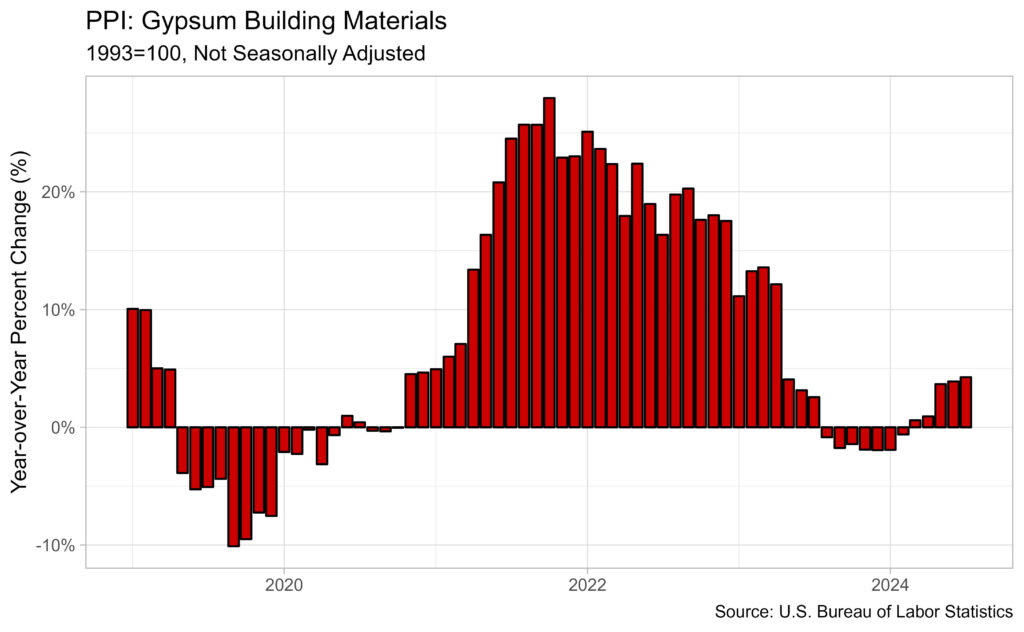
The non-seasonally adjusted PPI for gypsum building materials rose 0.08% in July, following no change in June. The index was up 4.25% from last year, the largest yearly increase since April 2023, when it was up 12.14%.
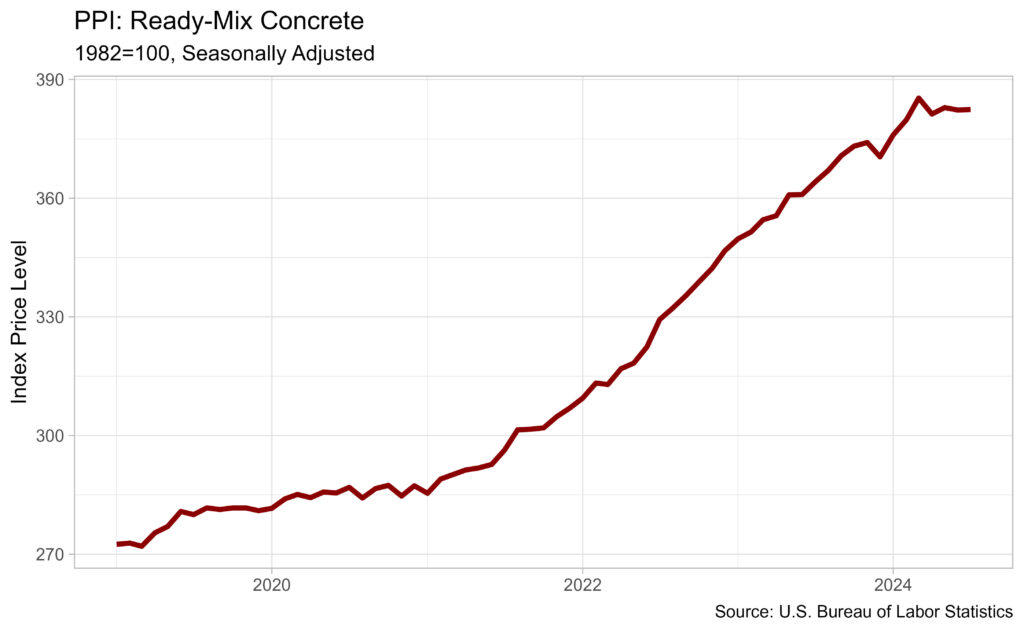
The seasonally adjusted PPI for ready-mix concrete increased 0.03% in July, following a 0.15% drop in June.
After peaking in March, monthly price rise for ready-mix concrete has been basically flat for four months running.
Ready-mix concrete prices increased by 5.05% year on year in July 2023.
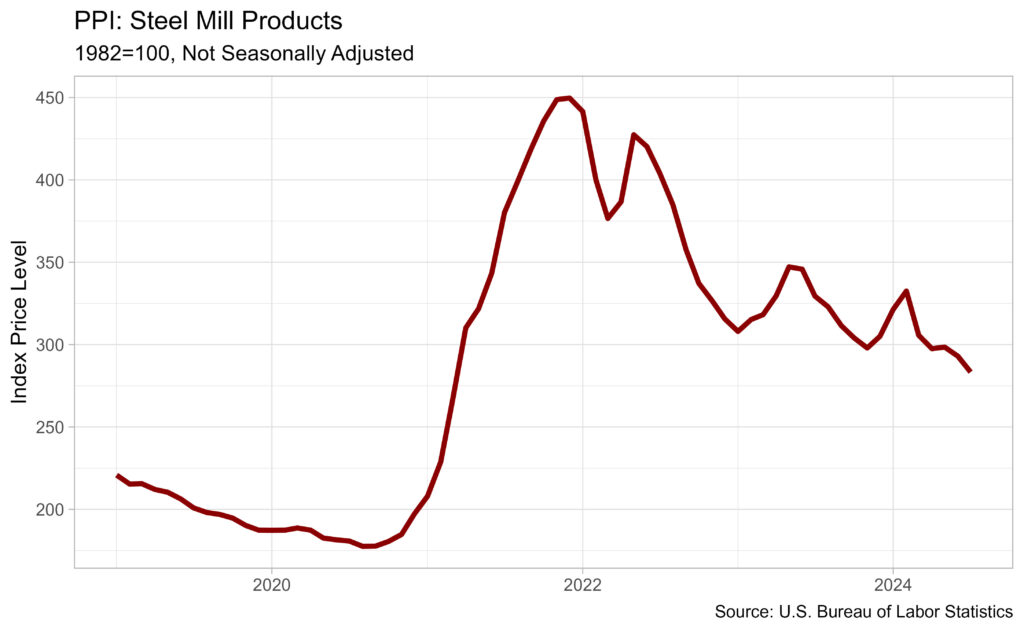
The non-seasonally adjusted PPI for steel mill goods declined for the second consecutive month, falling 3.29% in July.
Steel mill product prices are 13.99% lower than the previous year.
Overall, steel mill product prices have declined 36.99% since peaking in December 2021.
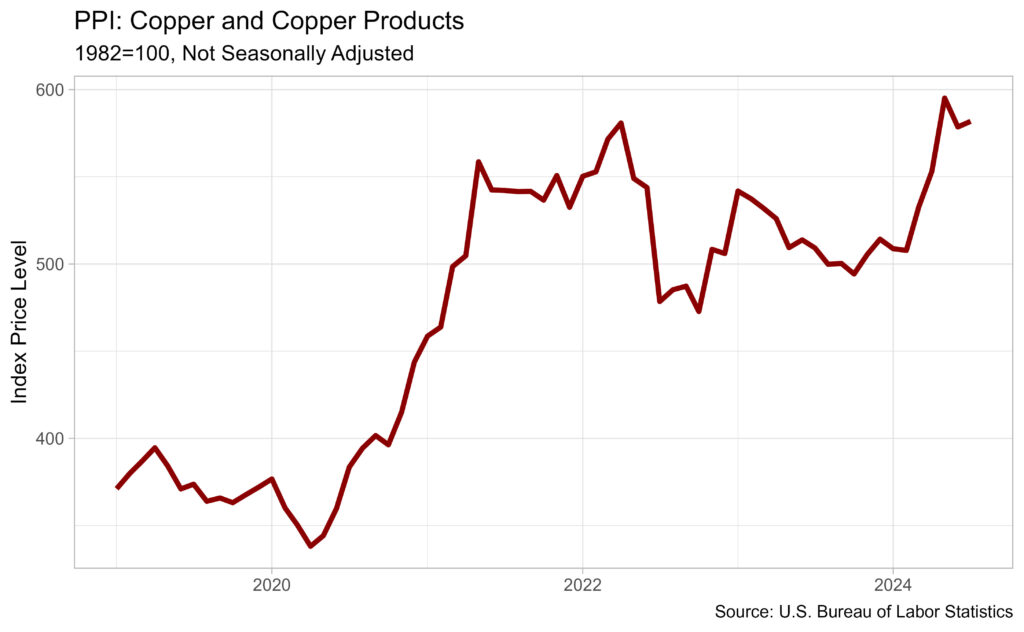
Copper’s non-seasonally adjusted special commodity grouping PPI increased by 0.56% in July, following a 2.79% decline in June.
The index rose 14.26% year over year.
Copper and nickel ores, copper cathode and refined copper, copper base scrap, secondary copper (alloyed and unalloyed), copper and brass mill shapes, copper wire and cable, and copper base castings (excluding die-castings) are all included in this category.
[Read more about this topic on Eyeonhousing.org]

You may also like...


-

BuilderWire
Ecommerce Solutions for Lumber & Building Materials (LBM Industry). BuilderWire, Inc. integrates the latest Internet technologies to help improve your company’s operational efficiencies and the way you sell and service customers on the web.
Schedule a Demo Today